The Frustrating LOB
April 13, 2008
Last night, the Reds lost 1-0 to the Pirates (!) leaving 12 on base. Tonight, they lost 4-3, leaving 11 on base. That, my friends, is frustrating. Last year, it seemed like the Reds were forever leaving men on. This year, George Grande and Chris Welsh are certainly upset about the missed opportunities. I decided to look it up, and see how bad it really is.
A well-posed question is half answered, so here’s the questions:
1) Which teams are best and worst in terms of scoring their baserunners? In particular, are the Reds as egregious about leaving men on as they seem to be?
2) How much difference is there between teams that are really good at scoring their baserunners, and teams that are bad? Is “baserunner scoring efficiency” a real trait, or is it just random?
With the help of ESPN’s team batting statistics, I got some data for 2007. They don’t list LOB, so I calculated it as follows:
LOB = Hits + Walks + HBP – CS – GDP – R
I think that’s correct. Once a guy gets on, he gets out or scores. Fielders choice doesn’t matter — on the play, there is no hit, and the number of runners does not change. Yes, I’ve left off all those guys called out on interference or failing to touch a bag or whatever. I think being picked off counts as a CS. I probably am failing to account for runners who are thrown out trying to take an extra base. Those situations should be very small corrections to this analysis, and should not have any effect on the conclusions.
We can’t just look at this number in isolation, because good teams will have more baserunners, and thus will always have more LOB. So, we want to make a comparison based on the LOB opportunities.
The relevant comparison here is Baserunners, which is just LOB + R. This is a kind of “isolated baserunners” that ignores those runners who make outs on the basepaths. After all, I want to know the scoring efficiency of the men on base, as a result of their not being stranded. Maybe that’s a good way to think of it — an inverse strand rate for team batting.
Anyway, here’s the data from 2007. I normalized it to a per-game value.

If you are below the line, you are efficient with your baserunners, leaving fewer on base than most teams. The answer to question 1B) is immediately evident — the Reds are right about average. The Yankees not only get a lot of baserunners, but they leave comparatively few of them on base as well. Grrr. The Nats (aka the “Former Reds”) are the opposite — not many baserunners to begin with, and not too much success driving them in.
Why are some teams better than others? Maybe “well-balanced” teams are more efficient, because they more often have another good player coming up to drive in runners, while “single-superstar” teams are worse — that guy gets on and gets stranded. Or, maybe small-ball teams are more efficient, while Earl-Weaver-2-walks-and-a-homer team are less efficient? I don’t think there’s enough evidence to claim either one of those for sure.
How about the previous year? Here’s the same thing for 2006.

Man, look at those Yankees. And look how much Tampa Bay improved! Once again, the Reds are just about average.
So, is there any correlation? Here’s the Runs per Baserunner 2006 vs. 2007:
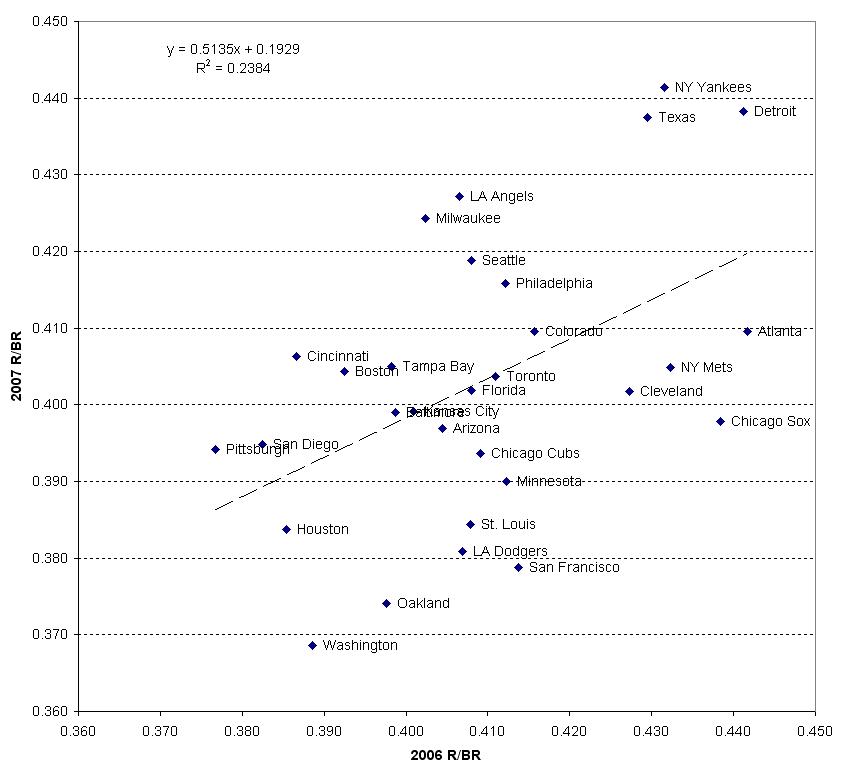
Teams to the top left have improved their efficiency, teams to the bottom right have degraded their efficiency. Now, this is efficiency only, so the overall number of baserunners is removed here. That’s why Tampa’s improvement looks small — their efficiency improved a little, their number of baserunners improved a lot.
Very poor correlation here, so you pretty much would have to say that the variation in R/BR is not a trait, but instead is random. Yeah, except that the Yankees, Tigers, and Rangers would say otherwise. I should probably go back and look at a few more years to see if some teams really can maintain above-average efficiency.
So, how much does it matter? That is, if your team could boost its efficiency back to the league average, how many more games would it win? I used the regression line for the 2007 data, and assumed that each team regressed to that mean. That is, I didn’t change their number of baserunners, just adjusted their runs scored as if their scoring efficiency were at the mean. Below is a table showing how many extra runs each team would have scored. Negative numbers mean that the team was more efficient than average already, so regressing to the mean would result in fewer runs scored.
Assuming 10 extra runs is an extra win, as a rule of thumb, Oakland and the Nats pick up 6 more wins, while NY loses 8, the Tigers 7, and the Rangers 6. Again, the jury is still out whether variations in efficiency are just luck (so we can say those teams were (un)lucky) or whether there is a good reason for the variations. Consistent with what we saw above, the Reds were just about average.
So, the questions at the top are just about answered. The Reds are about average for LOB. The total range in efficiency seems to be about 160 runs — pretty significant — with Washington and Oakland the worst, and the Tigers, Yankees, and Rangers the best. At first glance, it looks like there is no year-to-year correlation in efficiency, though the Yankees ongoing success is just enough to make you wonder.
(I couldn’t get this table any farther up, so it’s at the bottom. Also, this is my first sabermetric analysis — let me know what you think. If you’ve got other interpretations of these data, please comment!)
| Team | Extra Runs |
| Arizona | 12 |
| Atlanta | -11 |
| Baltimore | 9 |
| Boston | -1 |
| Chicago Cubs | 19 |
| Chicago Sox | 10 |
| Cincinnati | -5 |
| Cleveland | 4 |
| Colorado | -12 |
| Detroit | -70 |
| Florida | 4 |
| Houston | 38 |
| Kansas City | 8 |
| LA Angels | -45 |
| LA Dodgers | 44 |
| Milwaukee | -39 |
| Minnesota | 25 |
| NY Mets | -2 |
| NY Yankees | -82 |
| Oakland | 59 |
| Philadelphia | -26 |
| Pittsburgh | 18 |
| San Diego | 17 |
| San Francisco | 45 |
| Seattle | -28 |
| St. Louis | 37 |
| Tampa Bay | -2 |
| Texas | -63 |
| Toronto | 0 |
| Washington | 64 |
